OpenStack Monitoring
MONaaS
Alexandre Viau
alexandre.viau@savoirfairelinux.comThibault Cohen
thibault.cohen@savoirfairelinux.comMonitoring as a Servce
MONaas
What is monitoring?
- Executes checks
- Applies rules
- Alerts users
- Saves a history of the data
The state of monitoring in the cloud
“Amazon CloudWatch provides monitoring for AWS cloud resources and the applications customers run on AWS.”
- Passive monmitoring only
- Put API for custom metrics
- Alarms
- Use Auto Scaling to add or remove Amazon EC2 instances dynamically based on your Amazon CloudWatch metrics.

- Active and passive monitoring
- Services checks
- Put API for custom metrics
- Alarms
- In-instance Agent
OpenStack Telemetry
Ceilometer
Initial objective
To deliver a unique point of contact for billing systems to aquire all meters they need to establish customer billing, across all current and future OpenStack core components.

As of Grizzly:
To become the infrastructure to collect measurements within OpenStack so that no two agents would need to be written to collect the same data. Its primary targets are monitoring and metering.

Available measurments in Ceilometer
- CPU usage
- Memory usage
- Disk usage
- Network traffic
What's missing...
- Polling
- Services availability
- Applicative data
- Checks scenarios
- Buisness rules
- Scaling rules driven by system/application specific metrics.
Fil conducteur...
Monitoring as a Service
- RESTful API
- Highly available
- Fault-tolerant
- Self-monitored
What this would bring
Polling of in-instance agents
- NRPE
- SNMP
- SSH
- etc... New protocol??
Services monitoring
- Availability
- Response time
- HTTP scenarios
- TCP/UDP protocols (NTP, DNS, MYSQL, SMTP, IMAP, ...)
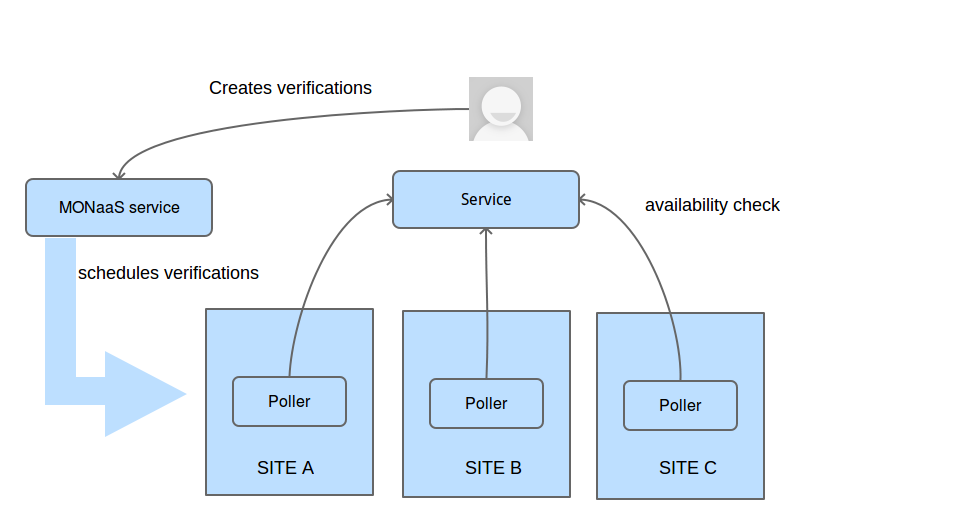
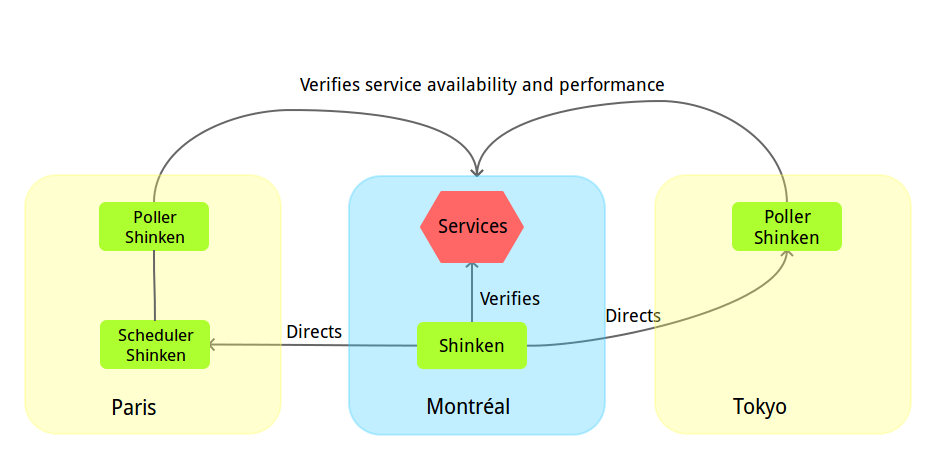
Multiple zones monitoring
- User experience from several zones
- Ensure availability
- More complete monitoring
- How are users in Montreal experiencing the new release of our XYZ application?
Multiple zones monitoring (schema)
What we have done
- Submitted the blueprint
- Openstack-dev
- Reached to the Ceilometer Team
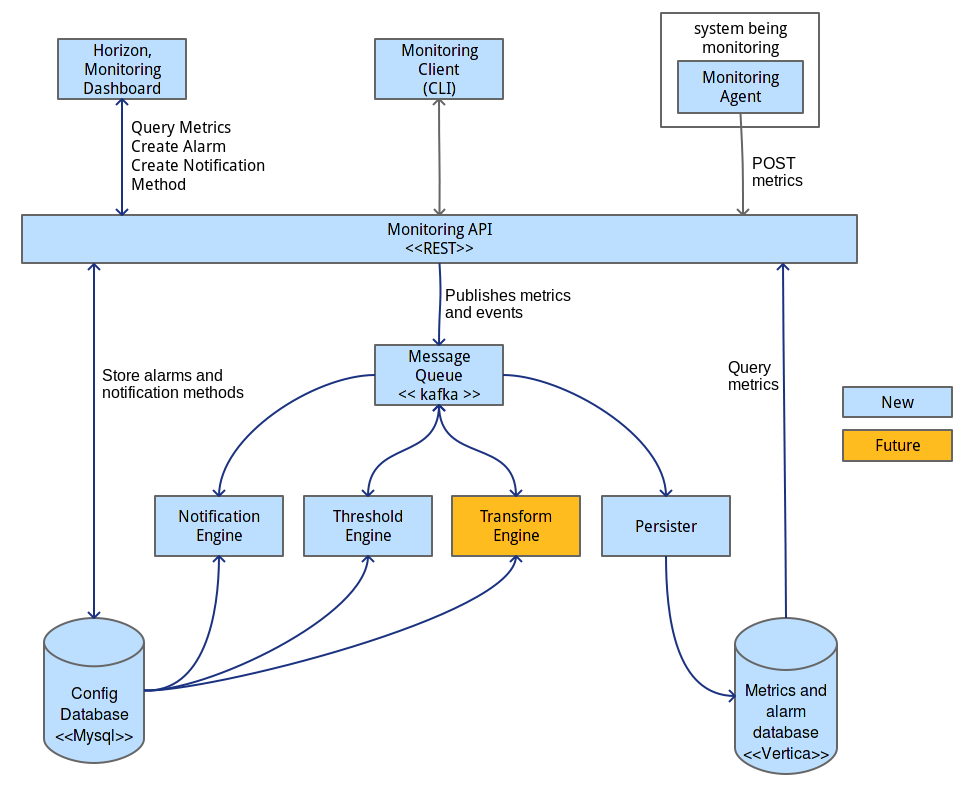
Implementation ideas
hpcloud-mon
Shinken as a monitoring framework ?
- Nagios Compatible
- Written in Python
- Modular architecture
- Supports buisness rules
- Possible integration in Horizon
Implementation example with Shinken
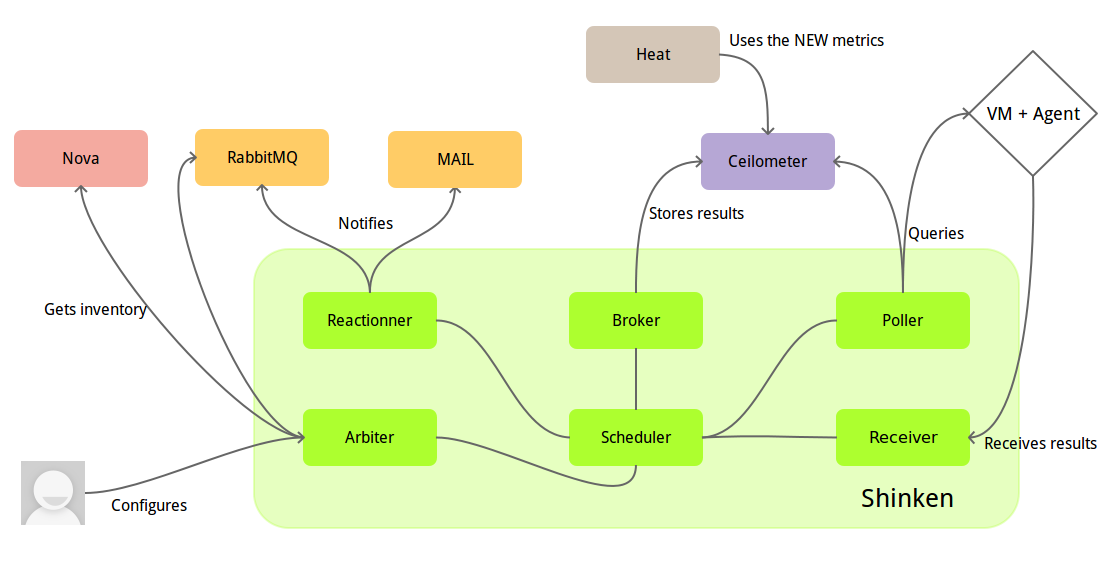
Implementation example with Shinken
OpenStack infrastructure monitoring
- Availability of each component trough it’s API
- Performance of OpenStack components trough Ceilometer
- Events monitoring trough RabbitMQ
Monitoring on the ground
- Standard monitoring of the infrastructure
- Servers
- Switches
- Firewall
- SAN
- ...
Three levels of monitoring
- Applicative (StatD support, ...)
- Platform (Apache, Mysql, Reddis, ...)
- Infrastructure (CPU, mémoire, IO, ...)
Shinken’s royaume concept would enable the separation of the three level monitoring.
References
- MONaas blueprint: https://blueprints.launchpad.net/ceilometer/+spec/monitoring-as-a-service
- Wiki page: https://wiki.openstack.org/wiki/MONaaS
- Announcement on openstack-dev: http://lists.openstack.org/pipermail/openstack-dev/2014-May/034189.html
Questions / Discussion

⇑⇑ savoirfairelinux.github.io/MONaaS-presentation/en ⇑⇑